Back to Design Solutions
Performance Specifications
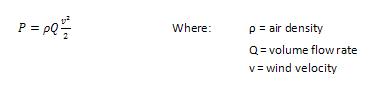
The aim of the project itself is to provide power using renewable wind energy. We therefore need an estimation of how much power our design we can produce. We start with the equation for power associated with wind passing through a capture area:
However, there are limitations on the amount of power that we can get from our wind turbine. The first limitation is the Betz Limit. The Betz Limit applies to all wind turbines, whether they are horizontal axis wind turbines or vertical axis wind turbines. No wind turbine can be 100% efficient because a wind turbine works by taking the energy of the wind from the air as it passes through the turbine to move the blades. If a wind turbine were 100% efficient, it would take all of the energy from the wind, which would mean that the air would stop moving and no air would be able to pass through the turbine, thereby producing no more energy. To keep the air moving, a wind turbine cannot be 100% efficient. The ideal or maximum efficiency (ratio of maximum power obtained from the wind to the total power available from the wind) was discovered to be 59.3% or 16/27 and is known as the Betz Limit. We must also take efficiency (η) into account in estimating power. This term will account for loss of energy due to factors like friction in our design.
Taking these limitations into account and replacing volume flow rate (Q) with its equivalent term: area (A) times velocity (v), our power equation becomes:
Taking these limitations into account and replacing volume flow rate (Q) with its equivalent term: area (A) times velocity (v), our power equation becomes:
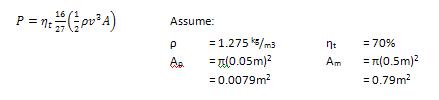
We assumed air density (ρ) to be 1.275 kg/m3 because this standard at sea level. We assumed efficiency (ηt) to be 70%, although a more accurate efficiency given our actual prototype will be determined during testing. Capture area (A) is the area swept by the blades, which we assumed to be a circle for ease of calculations. For our full scale model, which would ideally have a diameter of 1m, we assumed a capture area of 0.70m2, and for our small scale prototype which we intend to build with a diameter of 0.1m, we assumed a capture area of 0.0079m2.
Using these assumptions and data provided from the National Climactic Data Center regarding the average and maximum wind speeds for the city of Baltimore we prepared a chart (Table 1) to compare the expected power outputs for our full scale model and small scale prototype to ensure that our design would be practical and to ensure that we would have a testable power output from our small scale prototype.
Using these assumptions and data provided from the National Climactic Data Center regarding the average and maximum wind speeds for the city of Baltimore we prepared a chart (Table 1) to compare the expected power outputs for our full scale model and small scale prototype to ensure that our design would be practical and to ensure that we would have a testable power output from our small scale prototype.
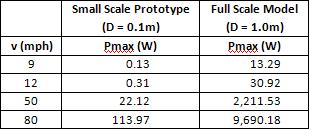
Table 1 shows that we should be able to get a measurable output from the size model we want by testing at 9 mph, the average speed for Baltimore. The value of 12 mph was included because this is the speed that braking systems in real Darrieus wind turbines will take effect, meaning that it is essentially the maximum wind speed at which the turbine would operate, if we were building a real turbine. This chart shows that at that maximum wind speed of 12 mph, the full scale turbine would produce around 30 W of power, which would charge the 12V battery in around 4 hours. The important theoretical concept to understand from this table is that for just a small increase in wind speed, the power output of the turbine increase exponentially.
